Supply/Demand Basics
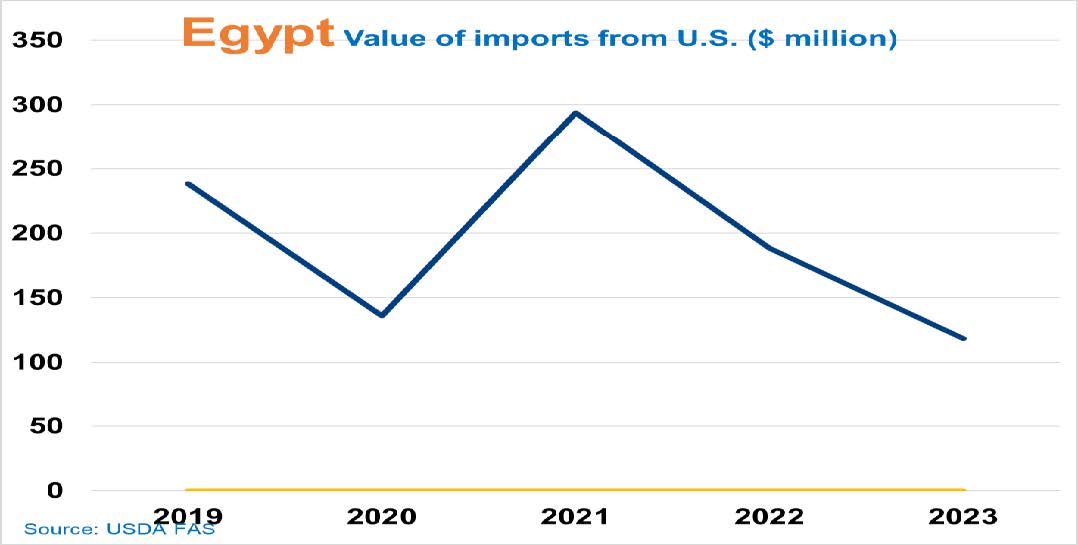
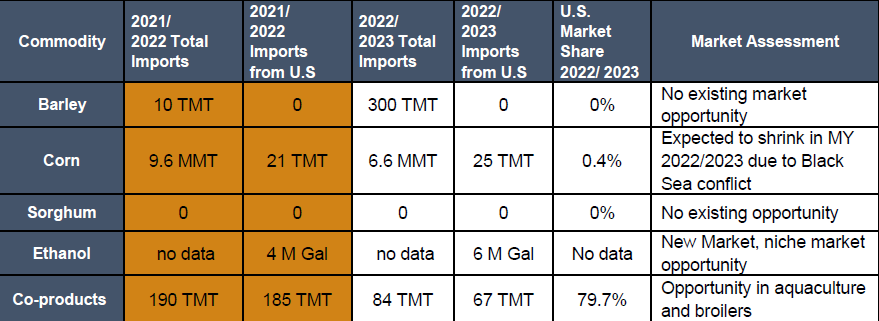
-Due to foreign exchange shortage, the largest corn market in the region, has seen a drop in its corn shipments moving from 9.6 MMT of imports in MY 2021/2022 to 6.6 MMT in current MY. While 7.4 MMT of corn was produced domestically in MY 2022/2023.
-29 TMT of U.S. CGM imports for the poultry and aquaculture sectors in MY 2022/2023 and 36 TMT of U.S. DDGS. High-protein corn co-products have recently been used by the aquaculture industry.
-The market has been severely impacted by the Black Sea conflict and rising prices.
Country Overview

-In January 2023, Egypt depreciated its currency, resulting in a 25% decline in the Egyptian pound’s value.
-Egypt’s long-standing challenges have intersected with multiple global shocks causing a foreign exchange crisis, historic inflation, and pressures to worsen the already-stretched fiscal and external accounts.
-Economic activity has been adversely impacted by the overlapping global shocks as well as domestic supply bottlenecks. Inflation has been in the double digits since March 2022, accelerating to 37.4 % (food inflation at 71.7%) in 2023.
Trade and Market Share Overview
-Black Sea corn shipment to Egypt is ranked first with 3 MMT while South American corn imports came second with 2.6 MMT. The U.S. did not ship corn to Egypt because of price competition.
-Due to a lack of foreign currency, Egyptian feed grain buyers prefer to ship small coastal vessels from the Black Sea rather than Panamax from the United States.
-The aquaculture industry in Egypt has been expanding rapidly -Egypt ranks seventh in the world in fish farming, and first in Africa in fish production.
Policy Overview
-Corn and soybeans have zero duty, while soybean meal, DDGS, and CGM are subject to a 5% import duty.
-Central Bank of Egypt (CBE) instructed commercial banks to limit use for transactions in foreign currencies. Due to the lack of foreign currency in the country. Egyptian grains importers have encountered growing issues in obtaining foreign currency to settle their foreign suppliers.