U.S. Export Statistics
The Export Sales data for the week ending December 28, 2023, was not available at the time this report was published due to the federal holiday on Monday, January 1, 2024. Date from the previous week is available below.
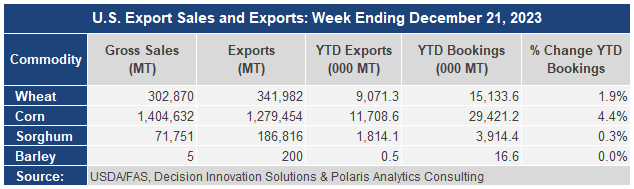
Corn
Net sales of 1,242,100 MT for 2023/2024 were up 23 percent from the previous week, but down 12 percent from the prior 4-week average. Increases primarily for Mexico (546,400 MT, including decreases of 26,300 MT), Colombia (168,200 MT, including 121,000 MT switched from unknown destinations), Japan (147,400 MT, including 47,500 MT switched from unknown destinations and decreases of 8,000 MT), Guatemala (80,300 MT, including 66,700 MT switched from Panama), and China (73,500 MT, including 68,000 MT switched from unknown destinations), were offset by reductions for Panama (39,200 MT). Total net sales of 11,200 MT for 2024/2025 were for Mexico. Exports of 1,279,500 MT–a marketing-year high– were up 47 percent from the previous week and 55 percent from the prior 4-week average. The destinations were primarily to Mexico (380,500 MT), Colombia (285,200 MT), Japan (154,900 MT), China (141,600 MT), and Saudi Arabia (72,800 MT).
Barley
No net sales were reported for the week. Exports of 200 MT was to Japan.
Sorghum
Net sales of 11,800 MT for 2023/2024 were down 95 percent from the previous week and 92 percent from the prior 4-week average. Increases reported for China (69,800 MT, including 58,000 MT switched from unknown destinations and decreases of 60,000 MT), were offset by reductions for unknown destinations (58,000 MT). Total net sales reductions of 62,400 MT for 2024/2025 were for China. Exports of 186,800 MT were down 26 percent from the previous week and 25 percent from the prior 4-week average. The destinations were to China (185,800 MT) and Mexico (1,000 MT).