

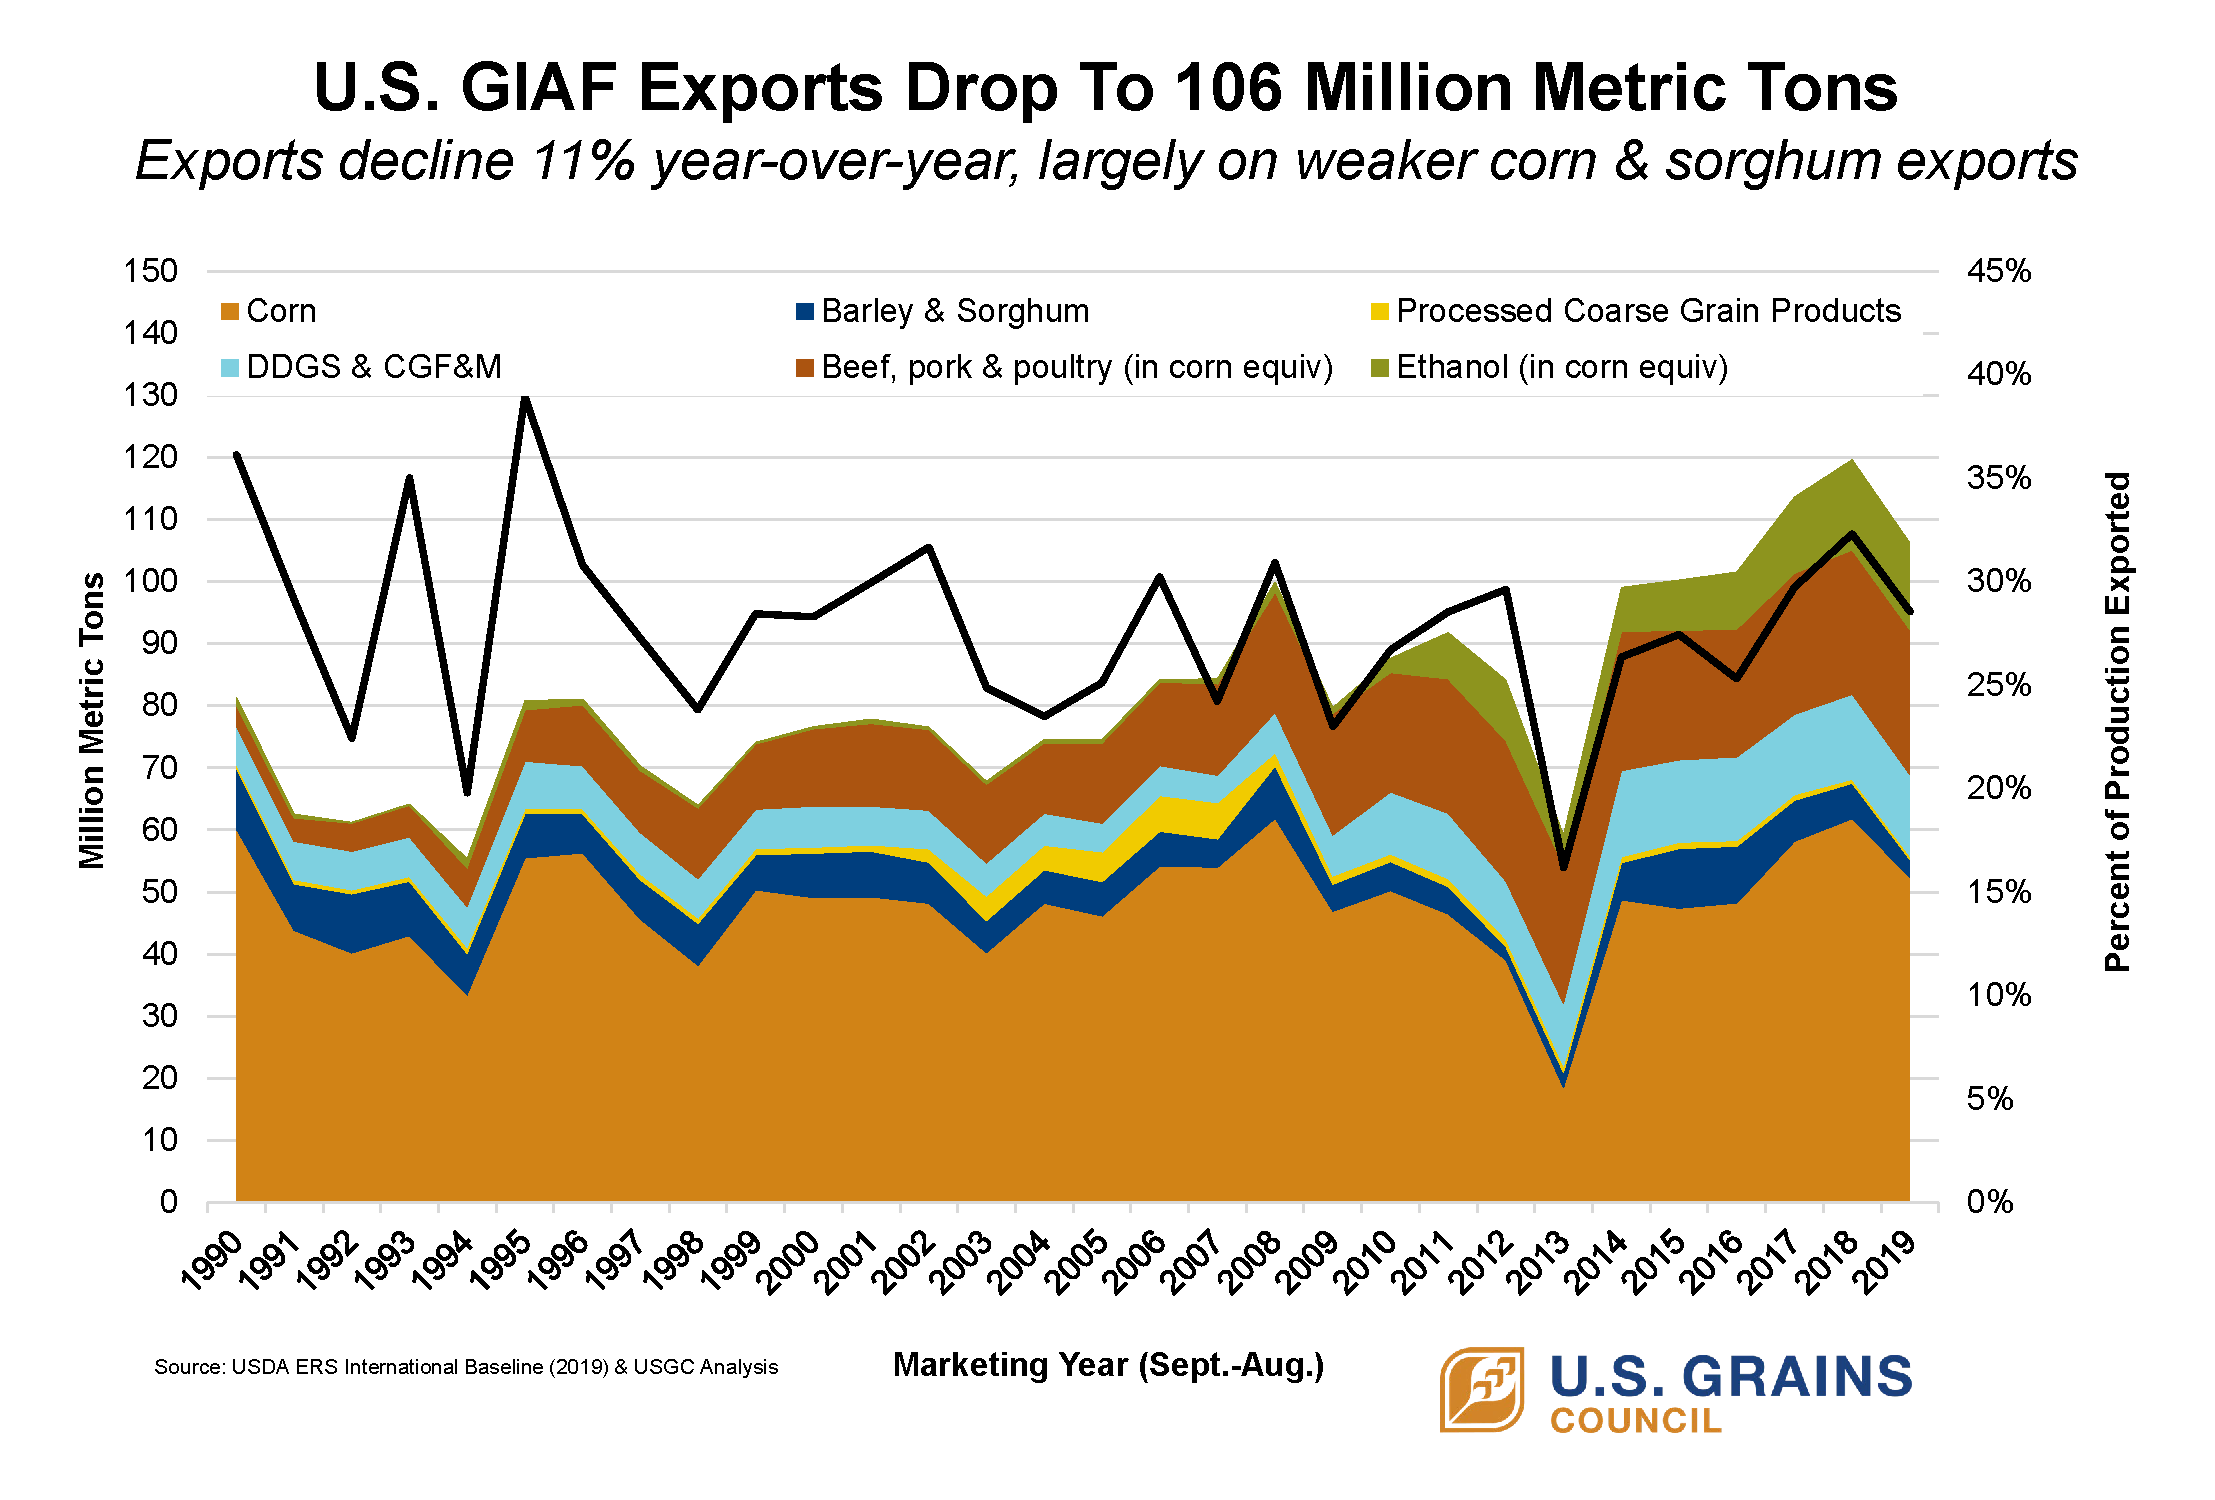
The final numbers for the 2018/2019 marketing year are in, showing overall exports of U.S. grain in all forms (GIAF) ranks as the third best export year of all time, despite declining 11 percent from last year’s all-time high to 106 million metric tons, equivalent to 4.17 billion bushels, according to data from the U.S. Department of Agriculture (USDA) and analysis by the U.S. Grains Council (USGC).
“Unfortunately, the weakness we first observed in February – particularly for corn – accelerated sharply in the final three months,” said Ryan LeGrand, USGC president and chief executive officer. “The increasingly disruptive trade dispute with China, weakening global economic growth, stronger export competition from South America and a U.S. dollar which continues to rise in value, all hurt U.S. competitiveness.”
Decreased exports were particularly pronounced for U.S. corn and sorghum. Together, the declines for these two commodities represented 92 percent of the overall 13.3 million ton reduction in GIAF exports in 2018/2019. While export declines were fairly widespread over all 10 product sectors the Council tracks (view the full list here), other categories did not suffer as much as corn and sorghum. The best performance was in pork, beef and poultry exports, which collectively showed a slight gain, reaching 23 million tons (905 million bushels) in corn equivalent, and together represented 21 percent of the GIAF total.
One bright spot was GIAF exports to Mexico, which increased two percent to squeak out a new record high of 25.6 million tons (one billion bushels). This success, however, was overshadowed by the dramatic 81 percent decline in exports to China since 2015/2016, with shipments totaling just 2.7 million tons (106 million bushels) in the 2018/2019 marketing year.
Strong South American Competition Hits U.S. Corn Exports
U.S. corn exports totaled 52.3 million tons (2.06 billion bushels), down 15 percent from the previous year as strong competition from plentiful South American supplies took a toll, especially in the final three months of the marketing year. Despite this decline, several markets in the Western Hemisphere did show year-over-year increases.
“The overall bad news for 2018/2019 U.S. corn exports was not equally shared across all country regions,” LeGrand said. “In an interesting development, all but one of the 10 markets showing the greatest positive unit growth this year were in the Western Hemisphere.”
Top buyer Mexico set a new record high at 16.1 million tons (633 million bushels), up 407,000 tons (16 million bushels) year-over-year. Canada saw the largest increase at 700,000 tons (27.6 million bushels) for a total of 2.42 million tons (95.3 million bushels) and ranking as the fifth largest buyer. Guatemala, El Salvador, Nicaragua, Costa Rica, Haiti, the Dominican Republic and Ecuador all realized gains in addition to New Zealand. These gains were offset by losses to South Korea, the European Union, Vietnam, Peru, Egypt, Saudi Arabia, Morocco, Israel, Taiwan and Colombia.
Contraction Of Chinese Purchases Limits U.S. Sorghum Exports
As recently as 2015/2016, U.S. sorghum exports to China totaled 7.1 million tons (280 million bushels), but exports to China in 2018/2019 collapsed to just 628,000 tons (24.7 million bushels), largely due to prohibitive tariffs in China. Overall, U.S. sorghum exports took a sharp downturn, decreasing 54 percent year-over-year to just 2.3 million tons (90.5 million bushels).
“The story behind decreased U.S. sorghum exports is simpler. The decline is the result of a sharp contraction in exports to China,” LeGrand said. “Between recent trade remedy actions by China and new punitive duties in China on sorghum, U.S. sorghum exports have declined significantly.”
Sorghum prices did stimulate exports elsewhere, but these increases were not enough to offset the loss of the Chinese market. The second largest buyer – the European Union, led by Spain – jumped to 610,000 tons (24 million bushels) and Mexico, ranked as the third largest buyer, purchased more sorghum at 489,000 tons (19.3 million bushels).
Ethanol Exports Ease From Record-Setting Pace
Even U.S. ethanol, which has been the fastest-growing U.S. agricultural export over the past 10 years, saw a small drop in 2018/2019 to 1.55 million gallons (almost 14 million tons or 551 million bushels in corn equivalent).
“While ethanol only represents 5 percent of the overall GIAF decline in 2018/2019, this year’s performance was a noticeable pause after five years of uninterrupted double-digit increases and new record highs,” LeGrand said. “Lower exports to China and Brazil accounted for 182 million gallons of loss – a casualty of reduced market access – but otherwise exports were largely up to the other top ethanol markets.
“Had those two markets remained even with last year’s shipments, U.S. ethanol exports would have likely set another new record high.”
China increased tariff rates and punitive duties on U.S. ethanol in the past year, resulting in a drastic decline from 108 million gallons (38.3 million bushels in corn equivalent) in 2017/2018 to virtually none in 2018/2019. A Brazilian TRQ on ethanol, combined with plentiful domestic supplies, also negatively affected U.S. ethanol exports, which declined by 72 million gallons (25.5 million bushels in corn equivalent).
Elsewhere, U.S. ethanol markets showed healthy increases, including to India, which set a new record as the third largest buyer at 200 million gallons (70.9 million bushels in corn equivalent), and South Korea, which increased 20 percent to a record of 92 million gallons (32.6 million bushels in corn equivalent). Notably, both of these markets currently import ethanol for industrial uses, rather than for fuel ethanol.
The European Union, the Philippines, Colombia and Peru all also showed increases year-over-year. Second largest buyer Canada remained essentially unchanged at 331 million gallons (117 million bushels in corn equivalent) while the mature, but stable, market awaits the implementation of new, higher blend rates to drive the next wave of growth.
U.S. DDGS Diversification Continues
U.S. DDGS exports remained relatively flat in 2018/2019 at 11.2 million tons, down 3.5 percent year-over-year. The largest decline was to Turkey, which realized a substantial decline to 468,000 tons, primarily due to a currency devaluation that sharply increased dollar imports in local currency and made letters of credit difficult to obtain. Without this export contraction to Turkey, overall U.S. DDGS exports would have likely increased year-over-year.
Mexico continues to represent the largest buyer of U.S. DDGS at 2 million tons, down slightly from the previous year. DDGS exports to Mexico have stayed relatively steady over the past three years, following significant growth between 2012/2013 and 2016/2017.
However, other regions continue to exhibit growth, particularly in Southeast Asia, where the Council has stepped up market development efforts in recent years – which have proven successful.
Southeast Asia now accounts for 30 percent of all U.S. DDGS exports, reaching a record 3.4 million tons in 2018/2019, up 10 percent year-over-year and up 233 percent since 2012/13. Four of the 10 largest U.S. DDGS export markets are now in Southeast Asia – Vietnam (1.3 million tons), Indonesia (973,000 tons), Thailand (725,000 tons) and the Philippines (247,000 tons).
As the 2019/2020 marketing year is now in full swing, the Council will continue working in these markets and more around the world to promote the quality, reliability and value of U.S. coarse grains, co-products and ethanol. Follow along throughout the year via the USGC GIAF portal, which tracks year-over-year export data and historical charts through an interactive database.
About The U.S. Grains Council
The U.S. Grains Council develops export markets for U.S. barley, corn, sorghum and related products including distiller’s dried grains with solubles (DDGS) and ethanol. With full-time presence in 28 locations, the Council operates programs in more than 50 countries and the European Union. The Council believes exports are vital to global economic development and to U.S. agriculture’s profitability. Detailed information about the Council and its programs is online at www.grains.org.