Supply/Demand Basics
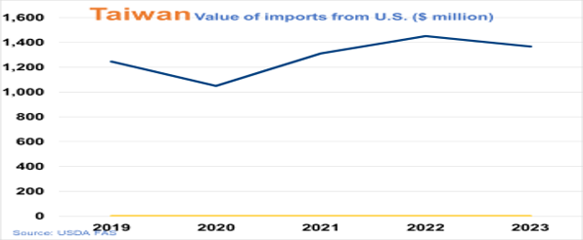
- #6 U.S. agricultural product market ($3.8 billion in MY 2022/2023).
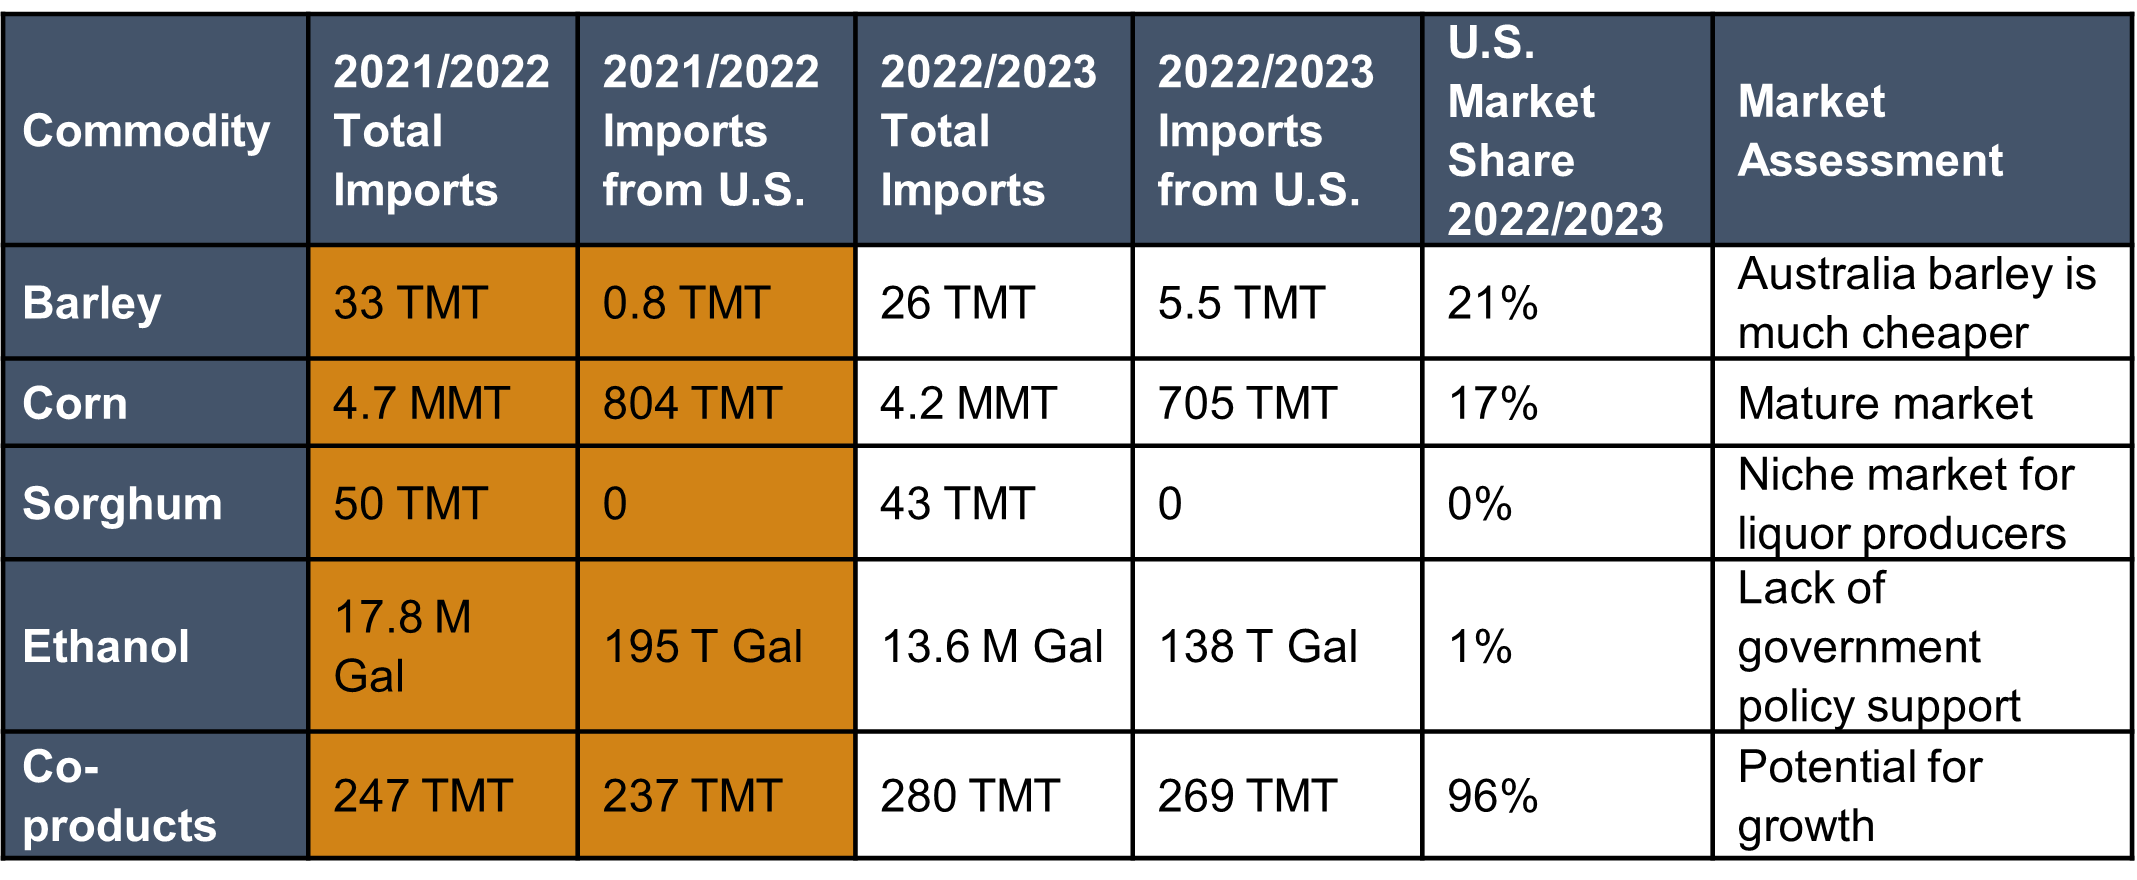
- #9 U.S. corn market (705 TMT in MY 2022/2023).
- #4 U.S. barley market (5.5 TMT in MY 2022/2023).
- #10 U.S. DDGS market (269 TMT in MY 2022/2023).
- Imported grains meet about 98% of local demand. Feed sector uses about 95% of imported corn.
- Swine and poultry (including duck) are major coarse grain users.
- Two wet milling plants producing HFCS, using about five percent of imported corn.
- Total coarse grain imports maintain at about 4.5 MMT annually.
Country Overview

- Diplomatic isolation, limited land space, aging population, small agricultural sector and dependent on imported raw materials and fuels.
Trade and Market Share Overview
- Aging population with a negative growth rate leading to a decrease in overall food consumption.
- U.S. corn was much less competitive in MY 2022/2023 due to strong USD and logistic issue.
- DDGS import volume increased because container freight weaken and relatively price competitive to SBM.
- The location of U.S. barley is far from the container hubs, making it’s hard to compete with Australian barley.
- Taiwan imported sorghum mostly for liquor production, but U.S. sorghum varieties with less tannin and starch which are not suitable for Taiwanese Baijiu industry.
Policy Overview
- The government has been encouraging more feed corn and sorghum planting by lifting the restriction of farmland utilization (so-called Big Silo Project) to increase food self-sufficiency.
- The authorities slowed down the approval process of new GM varieties, and slowly coped with the application of new biotechnology.
- Taiwan currently does not have a solid policy to support fuel ethanol use but start considering including bio-fuels to be one of carbon reduction.
- Taiwan Ministry of Agriculture released “Taiwan’s 2050 Net Zero Pathway and Strategy” to accelerate agriculture sustainability, which is a good opportunity to establish US-Taiwan agricultural collaboration by promoting CSAP/SCE.

