Chicago Board of Trade Market News

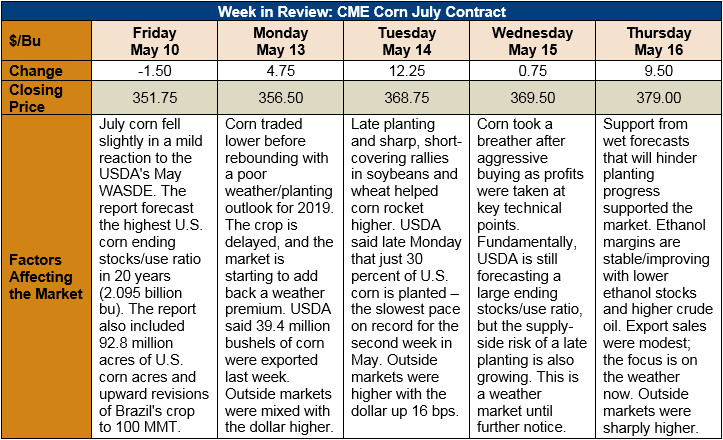
Outlook: July corn futures are 27 1/4 cents (7.7 percent) higher than last Thursday’s close as the delayed planting pace prompted traders to add a “weather premium” to prices. The data showing the corn crop’s late start spurred aggressive short covering from managed money funds and helped propel the market higher. Corn futures’ recent gains have come even though the May WASDE was largely interpreted as bearish.
The May WASDE report was largely bearish the corn market, despite futures’ recent rally. USDA held its expectations of 2019 corn acreage steady from the March Planting Intentions report at 92.8 million. Despite the delayed planting, which will likely lower corn yield potential in some areas, USDA issued a 2019 U.S. yield forecast of 11.053 MT/ha (176 bushels/acre), which is just shy of the country’s record highs. The combination of yield and planted acres left USDA to forecast 2019/20 production of 381.78 MMT (15.03 million bushels) – a 4 percent increase from 2018/19.
On the demand side, USDA increased domestic corn use 2 percent from 2018/19 after boosting feed and residual use 3 percent. The agency also anticipates a 1 percent reduction in exports; 2019/20 corn production is estimated at 381.78 MMT (15.03 bbu) and ending stocks at 63.13 MMT (2.485 bbu).
Beyond the U.S. corn forecast, USDA issued a tighter-supply outlook for sorghum, paring back planted acres 11 percent from 2018/19 and lowering the production forecast 15 percent. Exports were forecast 18 percent higher but total use estimates fell as feed/residual use was forecast lower. USDA lowered its ending stocks figure 25 percent but also issued a 2019/20 price forecast that was down 20 cents from the prior year. Further, USDA increased 2019/20 barley acres 4 percent. Barley ending stocks were forecast slightly higher while oats were left the same as 2018/19. USDA lowered its price forecast for both commodities.
Internationally, USDA increased its forecast of Brazil’s corn crop production to 101 MMT and Argentina’s to 49 MMT. World ending stocks for 2018/19 also saw a big jump from 314 to 325.95 MMT based on larger world production figures. USDA’s outlook for 2019/20 world ending stocks was slightly lower, but there is little known about that crop year’s true potential yet. If recent history is any judge, supplies and ending stocks will be ample.
Delayed corn planting was again noted in Monday’s USDA Crop Progress report; progress is at less than half the 5-year average pace and corn emergence is at only one-third its usually pace. Delayed planting may increases odds of higher-than-normal prevented plant acreage.
USDA’s weekly Export Sales report featured net sales of 553 KMT and weekly exports of 983.9 KMT. The export figure was down 15 percent from the prior week; YTD exports are up 8 percent. YTD bookings are down 11 percent, which is slightly below USDA’s anticipated yearly decrease in exports of 6 percent. Other highlights include 70.2 KMT of sorghum exports and 1,000 MT of barley exports; barley exports are up 85 percent YTD.
From a technical standpoint, July corn formed what’s typically a major reversal signal for chart technicians on Monday. The contract forged a new contract low before rallying to close above the prior day’s high – a classic “key reversal.” The contract has since rallied over 20 cents but has twice met significant resistance at $3.80 – a psychological resistance point that also presently marks the 100-day moving average. The strength of the rally suggests the market is unlikely to resume a bearish trend in the near-term. Rather, the market will trade sideways unless it can post a strong close above $3.80, at which point the market would then look to test $3.90 or $4.00.

