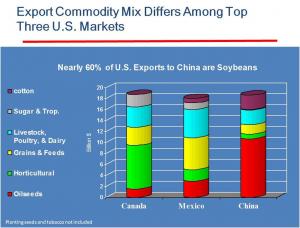
The U.S. Department of Agriculture reports that in terms of value for U.S. agriculture exports, both Canada and Mexico are close to China as top markets, all markets in which the U.S. Grains Council is heavily active in. The purchasing of each individual market is in the neighborhood of $18 billion annually. This chart illustrates the different mix of commodity purchases for each of these key markets. As the chart illustrates, oilseeds make up more than 50 percent of China’s agriculture imports from the United States. About 45 percent of U.S. agriculture exports to Canada are horticultural products, while U.S. agriculture exports to Mexico are more evenly distributed, but feeds and grains make up the majority of exports to Mexico. As you can see, all three markets are dominated by a different export, proving the diversity of U.S. agriculture exports.
Feb 25, 2021
Feb 23, 2021
Jan 21, 2021
Jan 16, 2021
Feb 22, 2018


