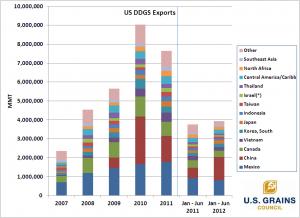
The chart shows the importance of the top ten markets, which account for all but about 1 mmt of total U.S. exports. Mexico and Canada started out as the top two markets, but were challenged by China in 2010 and 2011 in spite of the anti-dumping investigation in China in 2011. The year-to-date exports show that total DDGS exports are tracking at a higher pace than 2011, but that growth is driven by China, recovering its imports from last year with the uncertainty of the antidumping case behind us. Interestingly, even in 2011 China was the number 2 market.
Even without China, U.S. DDGS exports in 2011 declined from 2010 by about 230,000 mt, and the pace in 2012 is down about 500,000 mt from 2011 year-to-date. This reflects high prices, increased U.S. domestic DDGS use, and the tapering off of U.S. ethanol production growth.