B. Moisture
Moisture content is reported on official grade certificates, and maximum moisture content is usually specified in the contract. However, moisture is not a grade factor; therefore, it does not determine which numerical grade will be assigned to the sample. Moisture content is important because it affects the amount of dry matter being sold and purchased. Moisture content is also an indicator of whether a need exists for drying, has potential implications for storability and affects test weight. Higher moisture content at harvest increases the chance of kernel damage during harvesting and drying. Moisture content and the
amount of drying required will also affect stress cracks, breakage and germination. Extremely wet grain may be a precursor to high mold damage later in storage or transport. While the weather during the growing season affects yield, grain composition and the development of the grain kernels, grain harvest moisture is influenced largely by crop maturation, the timing of harvest and harvest weather conditions. General moisture storage guidelines suggest that 14.0% is the maximum moisture content for storage up to six to 12 months for quality, clean corn in aerated storage under typical U.S. Corn Belt conditions, and 13.0% or lower moisture content is recommended for storage of more than one year.
RESULTS
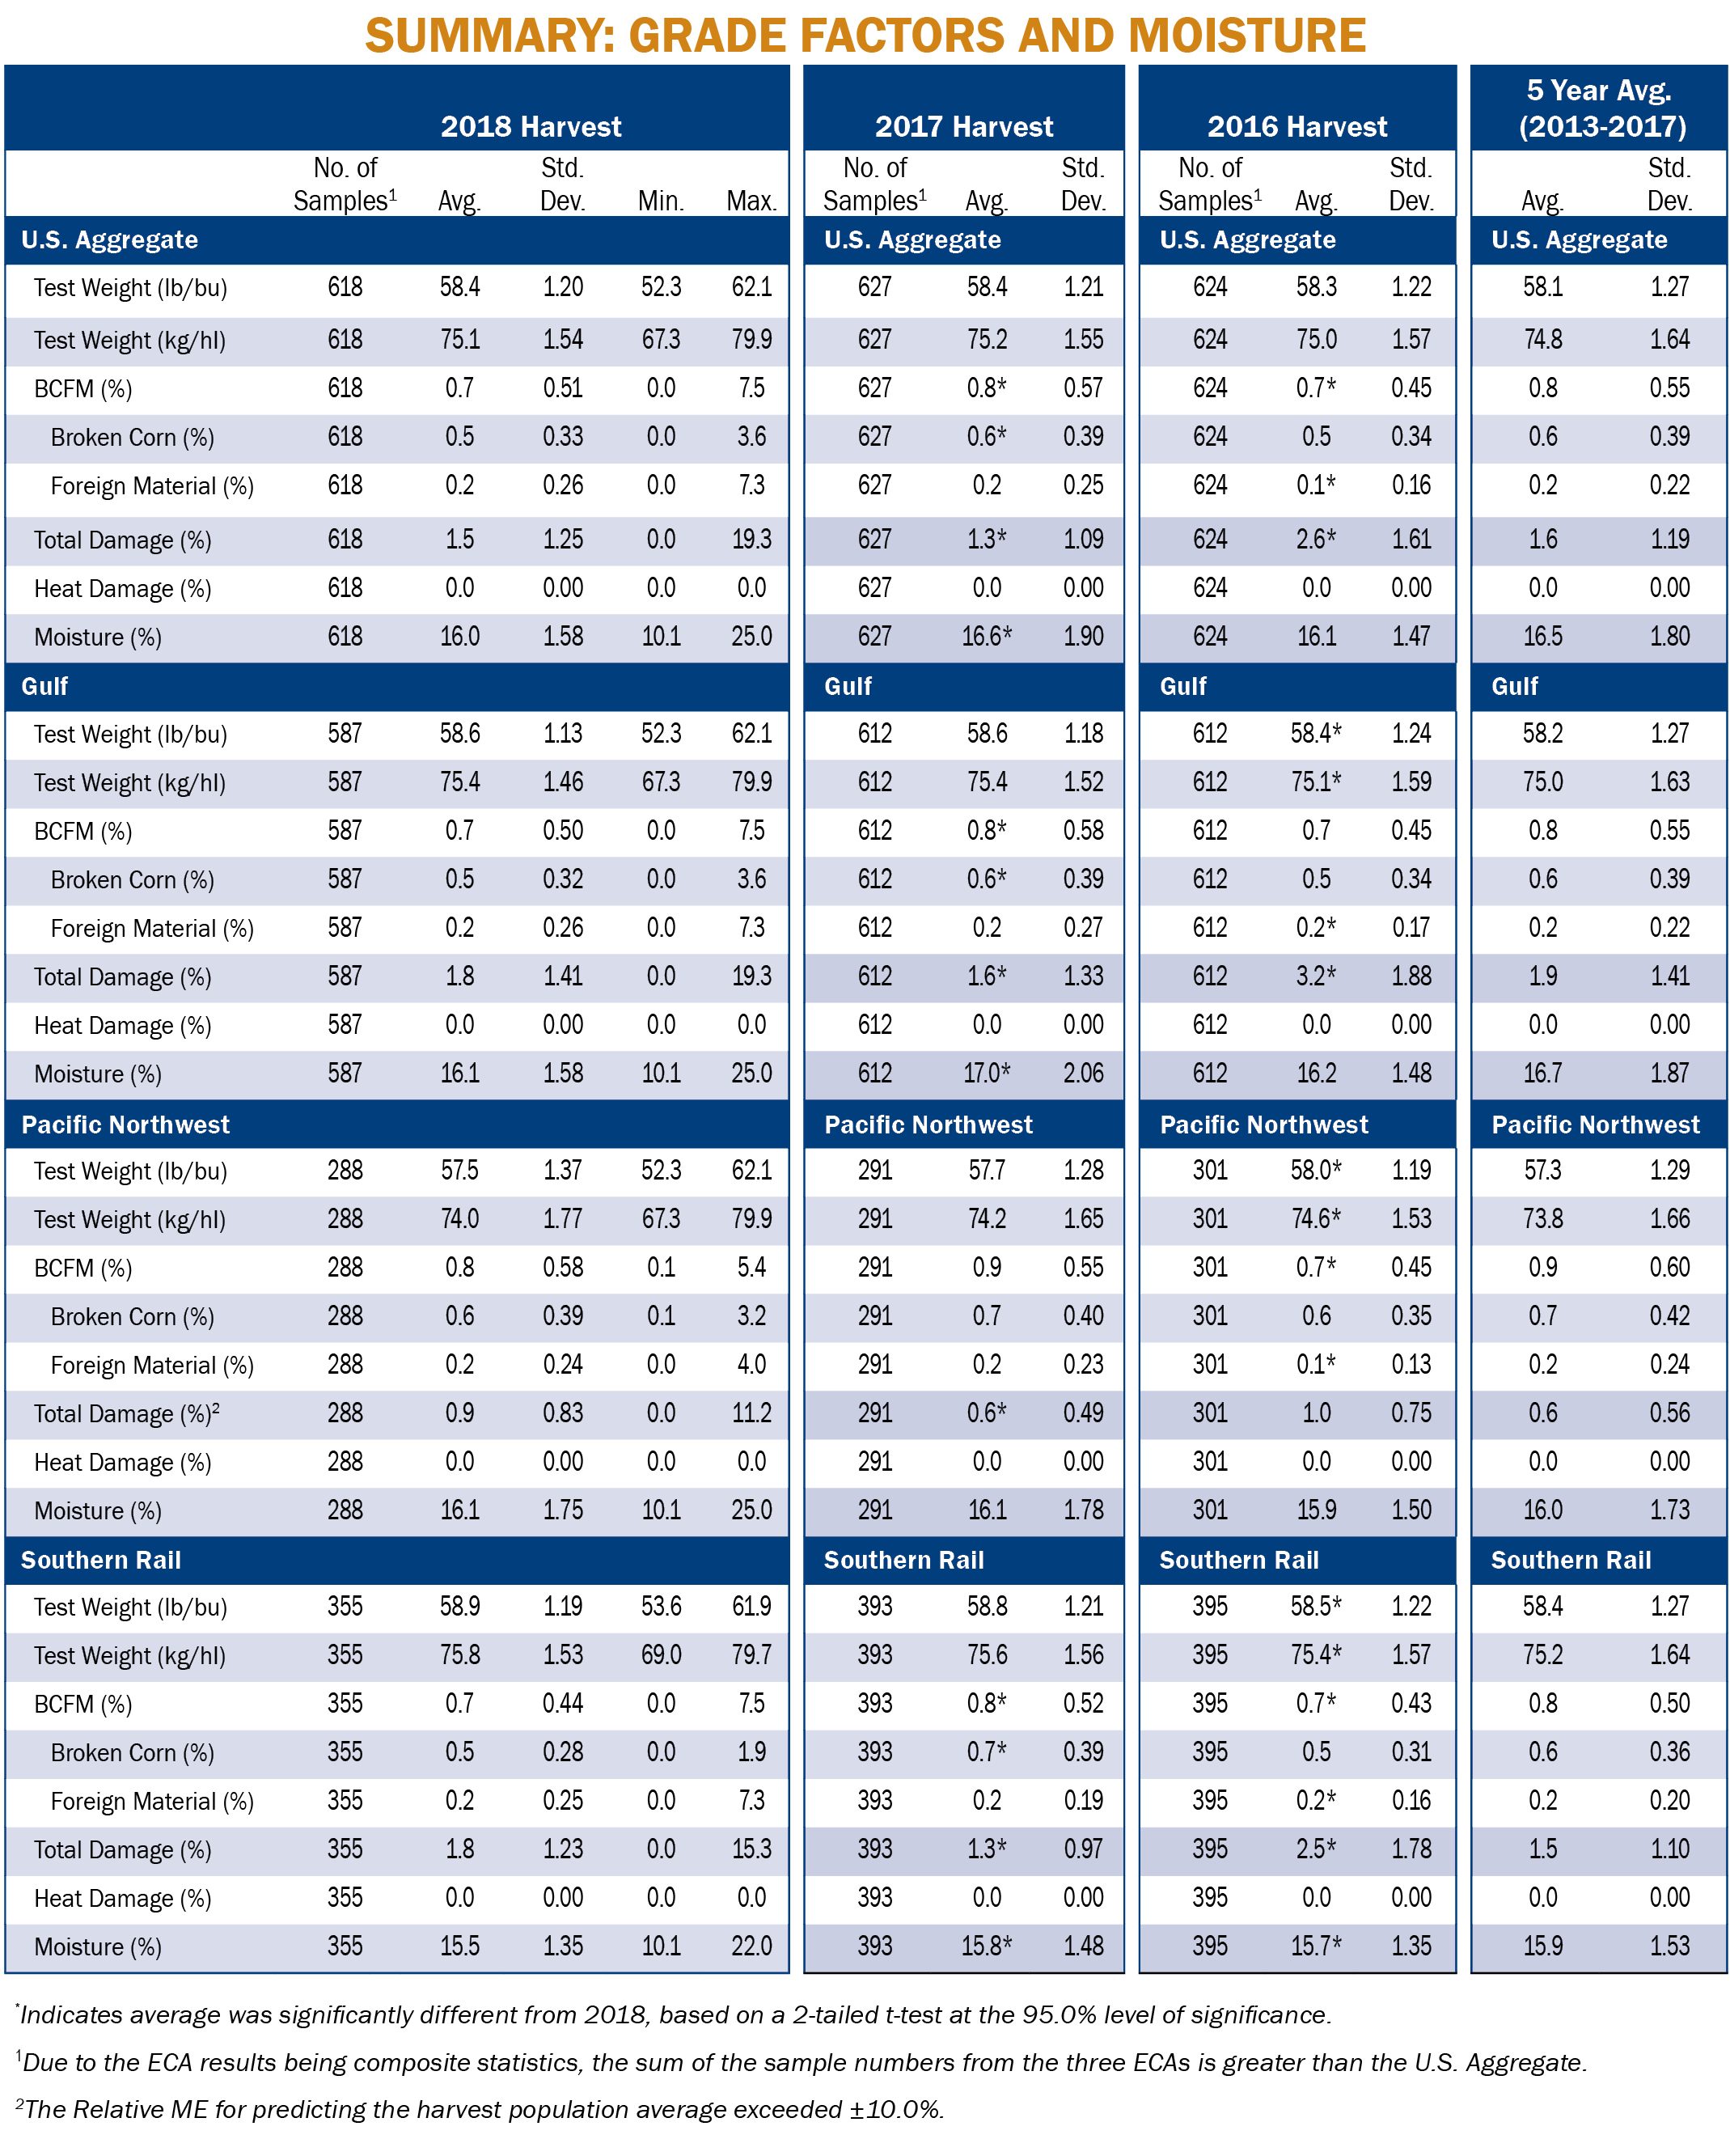
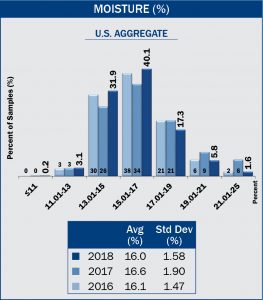
- Over eight years, average U.S. Aggregate moisture has ranged from a low of 15.3% in the 2012 drought year to a high of 17.3% in 2013. In 2018, the average U.S. Aggregate moisture content recorded at the elevator was 16.0%, which was lower than 2017 (16.6%), 2016 (16.1%) and the 5YA (16.5%).
- U.S. Aggregate moisture standard deviation in 2018 (1.58%) was lower than 2017 (1.90%) and the 5YA (1.80%), but slightly higher than 2016 (1.47%).
- The range in moisture content values in 2018 (10.1% to 25.0%) was similar to 2017 (9.0% to 24.4%) and 2016 (11.2% to 23.7%).
- There were fewer high-moisture samples in the 2018 samples than those in 2017 and 2016, with 24.8% of the samples containing more than 17.0% moisture, compared to 36.2% in 2017 and 28.4% in 2016. This distribution indicates that the 2018 crop required less drying than the 2017 and 2016 crops.
- In the 2018 crop, 13.6% of the samples contained 14.0% or less moisture, compared to 12.8% in the 2017 samples and 12.5% in the 2016 samples. Moisture content values of 14.0% and below are generally considered a safe level for longer-term storage and transport.
- The 2018 moisture values were distributed with 35.1% of the samples containing 15.0% or less moisture. The base moisture used by elevators for discounts is generally 15.0%. This moisture content is considered safe for storage for short periods during low wintertime temperatures.
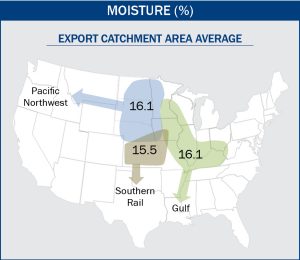
- The average moisture contents for corn from the Gulf and Pacific Northwest ECAs (both 16.1%) were higher than that from the Southern Rail ECA (15.5%).
- Average moisture levels for the Southern Rail ECA were lowest among all ECAs for 2018, 2017, 2016 and the 5YA. Samples from the Southern Rail ECA usually contain lower moisture content due to generally favorable weather conditions for grain drying.
- Moisture contents in the 2018 samples were somewhat lower than in 2017 and the 5YA, but care should still be taken to monitor and maintain moisture levels sufficiently low to prevent possible mold growth.